Using Slicers and Timelines for Dynamic Interactivity
Using Slicers and Timelines for Dynamic Interactivity
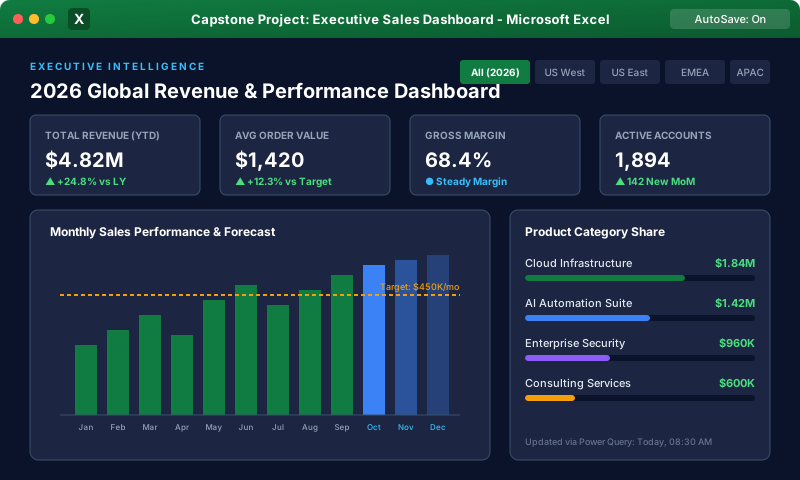
Traditional dropdown filters are hidden inside header arrows and allow only one-by-one inspection. Slicers and Timelines provide clickable, visually striking filter buttons that float above your worksheets, turning ordinary spreadsheets into modern, application-like interactive reporting dashboards.
1. What are Slicers and Timelines?
- Slicers: Floating graphical panels containing clickable buttons for categorical fields (e.g., Department, Region, Product Line, Sales Rep).
- Timelines: Specialized chronological filter sliders designed exclusively for date fields, allowing users to scrub smoothly across Years, Quarters, Months, and Days.
 Click to Zoom
2. Step-by-Step: Adding Slicers & Timelines
- 1Click any cell inside your Pivot Table.
- 2Go to the PivotTable Analyze tab (or Insert tab).
- 3In the Filter group:
- Click Insert Slicer: Check categorical fields (e.g., 'Region', 'Category', 'Manager').
- Click Insert Timeline: Check your date field (e.g., 'OrderDate').
- 1Click OK. Floating panels appear on your screen!
Interacting with Slicers:
- Single Selection: Click any button (e.g., North) to filter instantly.
- Multi-Selection: Hold Ctrl and click multiple buttons (e.g., North and West).
- Clear Filter: Click the funnel with a red 'X' in the top-right corner of the slicer (or press Alt + C).
3. The Holy Grail: Connecting One Slicer to Multiple Pivot Tables
The true power of Slicers in enterprise dashboards is their ability to control multiple Pivot Tables and Charts simultaneously from a single click:
- 1Create two or three separate Pivot Tables (e.g., Table 1: Sales by Region; Table 2: Top Products; Table 3: Monthly Trends).
- 2Right-click your Slicer (e.g., Region Slicer).
- 3Select Report Connections... (or PivotTable Connections...).
- 4A dialog box opens listing all Pivot Tables across your workbook.
- 5Check the boxes next to all Pivot Tables you want to synchronize.
- 6Click OK.
Now, clicking "North" filters all three Pivot Tables and all linked Pivot Charts in perfect harmony!
4. Formatting Slicers for Dashboard Presentation
In the contextual Slicer ribbon tab:
- Columns: Change from 1 column to 3 or 4 columns to create horizontal button bars across your dashboard header.
- Slicer Styles: Select custom corporate colors matching your dashboard theme.
- Hide Items with No Data: In Slicer Settings, check Hide items with no data to prevent users from clicking invalid combinations.
Multiple Choice Questions
1. What is the primary functional difference between a Slicer and a Timeline?
A. Slicers only work on numbers; Timelines only work on text B. Slicers filter categorical fields (names, regions); Timelines are specialized chronological sliders designed specifically for date fields C. Timelines require VBA programming D. Slicers cannot be printed Answer: B Explanation: Slicers filter categorical data fields using clickable buttons, whereas Timelines provide specialized chronological scrubbing exclusively for date fields.
2. How can you connect a single Slicer so that clicking one button filters three different Pivot Tables simultaneously?
A. Copy and paste the slicer three times B. Right-click the Slicer and configure 'Report Connections...' (checking all three Pivot Tables) C. Write an INDEX/MATCH formula D. Group the worksheets Answer: B Explanation: The 'Report Connections...' setting connects a single slicer to multiple Pivot Tables across the workbook, synchronizing them to common filter criteria.
3. How do you select multiple non-adjacent buttons within an active Slicer?
A. Hold down the Ctrl key while clicking the desired buttons B. Double-click the title C. Hold down Alt + Tab D. Right-click each button Answer: A Explanation: Holding the Ctrl key enables multi-selection of independent, non-contiguous slicer buttons.
4. What setting in the Slicer ribbon tab allows you to arrange slicer buttons horizontally in a row rather than a tall vertical list?
A. Button Alignment B. Columns setting (increasing the column count) C. Text Wrap D. Rotate 90 Degrees Answer: B Explanation: Increasing the 'Columns' property in the Slicer ribbon formats the buttons across multiple horizontal columns, creating a compact banner bar.
5. What keyboard shortcut clears an active filter from a selected Slicer?
A. Ctrl + Z B. Alt + C C. Shift + Delete D. F9 Answer: B Explanation: Pressing Alt + C clears the active filter selections from the currently focused slicer.
Goal Seek for Target Back-Calculation
Continue learning with hands-on practice, examples, and exercises in the upcoming topic.
Related Lessons
| Previous Lesson | Next Lesson |
|---|---|
| Pivot Charts Integration and Design | Goal Seek for Target Back-Calculation |
Practice Quiz
Test your understanding of this lesson with 5 questions. Each question has one correct answer.