Matplotlib Anatomy: Figure, Axes, Subplots & Ticks0%
Matplotlib Anatomy: Figure, Axes, Subplots & Ticks
Beginner12 min read•Updated: Jul 11, 2026
Matplotlib Anatomy: Figure, Axes, Subplots & Ticks
Reading Time: 8 Mins | Level: Intermediate
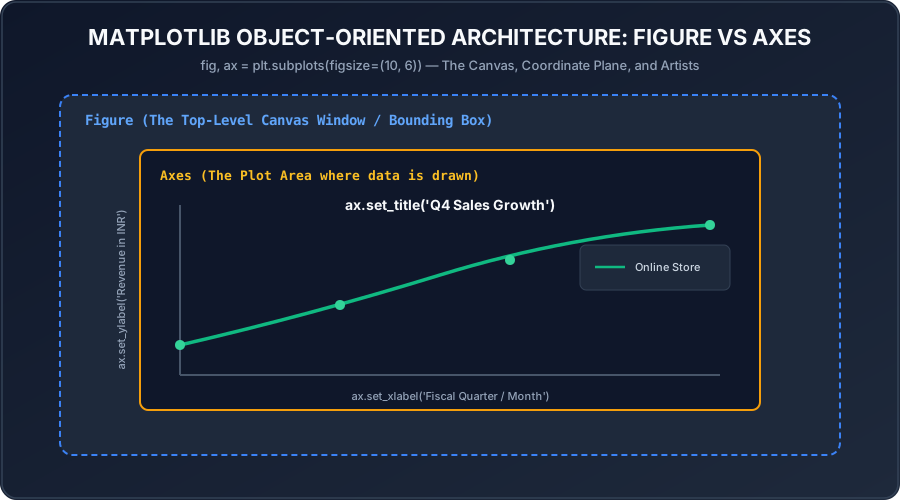 Click to Zoom
1. Object-Oriented (OO) API vs Pyplot State-Machine
Matplotlib has two interfaces:
- 1The Pyplot State-Machine (
plt.plot()): Implicit, MATLAB-like. Quick for throwaway scripts, but confusing for complex layouts. - 2The Object-Oriented API (
fig, ax = plt.subplots()): Explicit, clean, professional. You hold direct references to the Figure (the canvas) and Axes (the plot).
2. The Core Anatomy of a Plot
- Figure: The top-level bounding window holding all subplots, titles, and legends.
- Axes: The actual coordinate plotting area with an x-axis and y-axis.
- Axis / Ticks: The scales with major and minor tick markers and labels.
- Spines: The 4 boundary lines enclosing the plotting area (top, bottom, left, right).
Python
import matplotlib.pyplot as plt
fig, ax = plt.subplots(figsize=(8, 5))
ax.plot([1, 2, 3, 4], [10, 25, 20, 35], color='#2563eb', linewidth=2.5, marker='o')
ax.set_title('Monthly Performance Metric', fontsize=14, fontweight='bold')
ax.set_xlabel('Quarter')
ax.set_ylabel('Profit (in Lakhs)')
ax.spines['top'].set_visible(False)
ax.spines['right'].set_visible(False)
plt.show()
Interactive Quiz
Multiple Choice Questions
Question 1
In Matplotlib's Object-Oriented API, what does
fig represent?Question 2
What is an
Axes object in Matplotlib?Question 3
How do you create a 2x2 grid of subplots using Matplotlib's OO interface?
Question 4
How do you remove the top and right enclosing borders (spines) from a chart for a clean modern aesthetic?
Question 5
Why is the Object-Oriented interface preferred over
plt.plot() for production dashboards?Next Lesson
Line Plots, Markers, Line Styles & Multiple Series
Continue learning with hands-on practice, examples, and exercises in the upcoming topic.
Related Lessons
| Previous Lesson | Next Lesson |
|---|---|
| Setting Up Jupyter, Inline Plotting & Figure Sizing | Line Plots, Markers, Line Styles & Multiple Series |
Practice Quiz
Test your understanding of this lesson with 5 questions. Each question has one correct answer.